How to Draw Reflected Wave
YUKIMURA
Introduction to High School Physics
In this and the next lecture, we’ll consider graphing waves!
The reason why two lectures are necessary is that the graph of a wave is not a simple matter.
It is different from the so-called “ordinary graph” that you have learned in mathematics.
First, let’s review “ordinary graph”.
This has the property that “determining a value for x determines one corresponding value for y.”
This is called a 1-variable function.
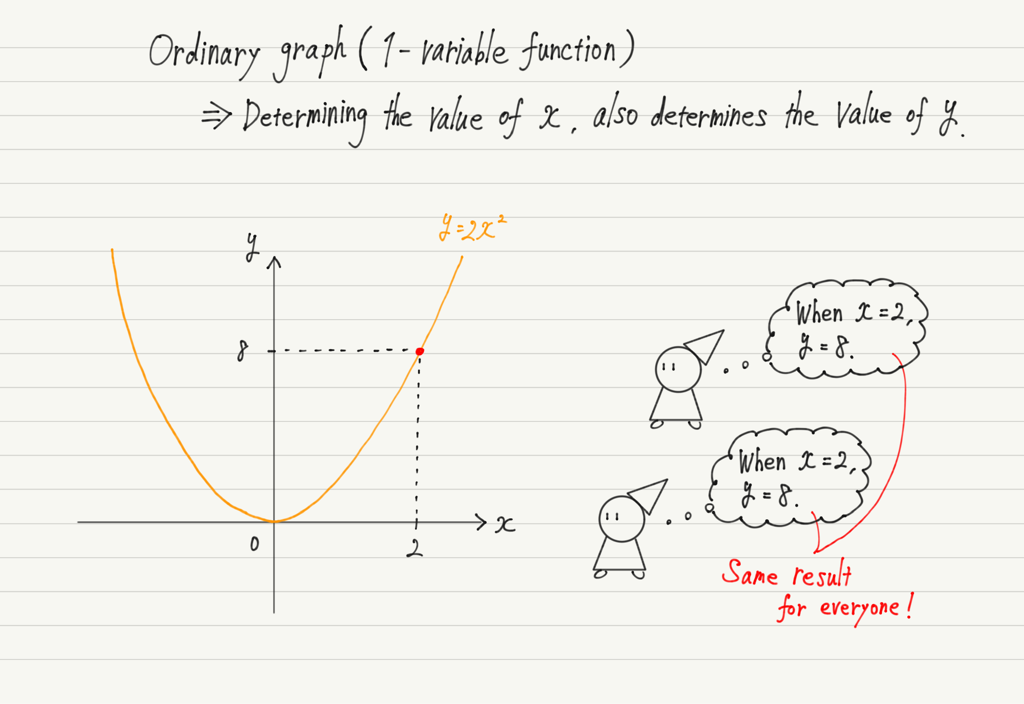
All functions learned in mathematics up to high school are such 1-variable functions.
In contrast, how about the graph of wave?
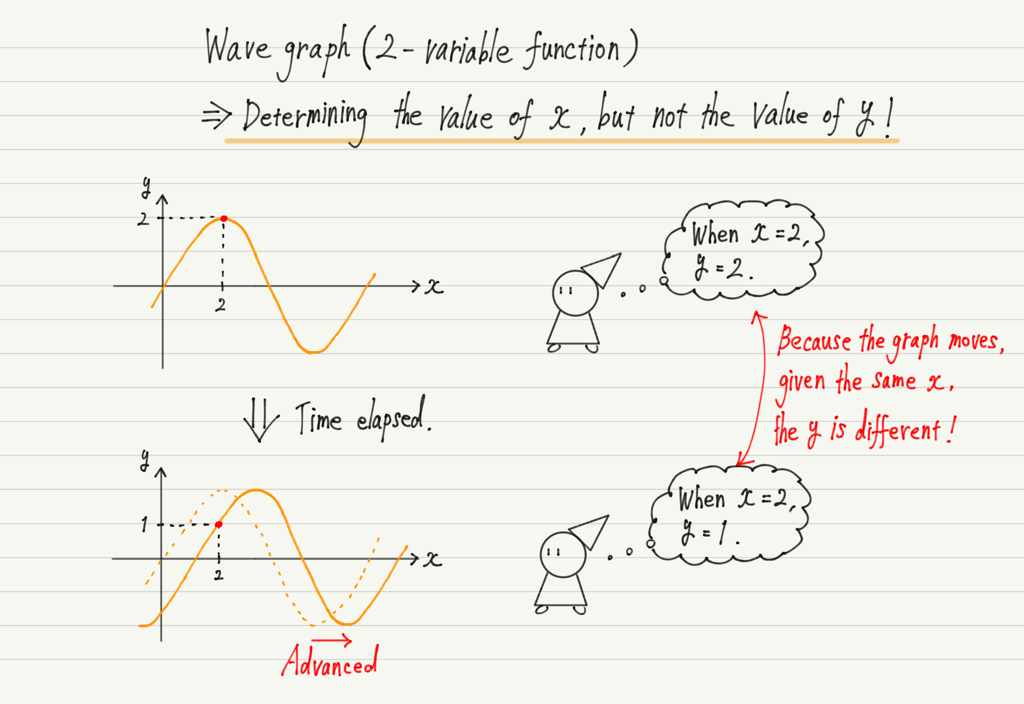
Thus, in the case of the graph of a wave, even if x is determined, the value of y cannot be determined!
This is a big problem!
The cause, of course, is that the waves are moving.
So if you want to tell the value of y, you have to tell not only the value of x, but also the time you saw the graph!
In summary, in order to determine the value of y in a wave graph, two variables, x (position) and t (time), must be specified.
Such a function is called a 2-variable function.
I hope you now understand that a wave graph is different from ordinary graph.
In short, “the wave moves, so it cannot be graphed as it is.”
There is no way to draw a graph that moves.
However, we cannot proceed without being able to draw a graph of waves, so let us consider whether it is possible to draw a graph of waves in any way.
The reason you can’t graph a wave in the first place is because there are two variables.
If there were only one variable, we could graph it, as we always do in math.
So, to graph the wave, consider the following.
There are really two variables, but just think of one of them as a constant!
If one of the two variables is a constant, it can be treated as the usual 1-variable function.
Now we can finally draw a graph of the wave!
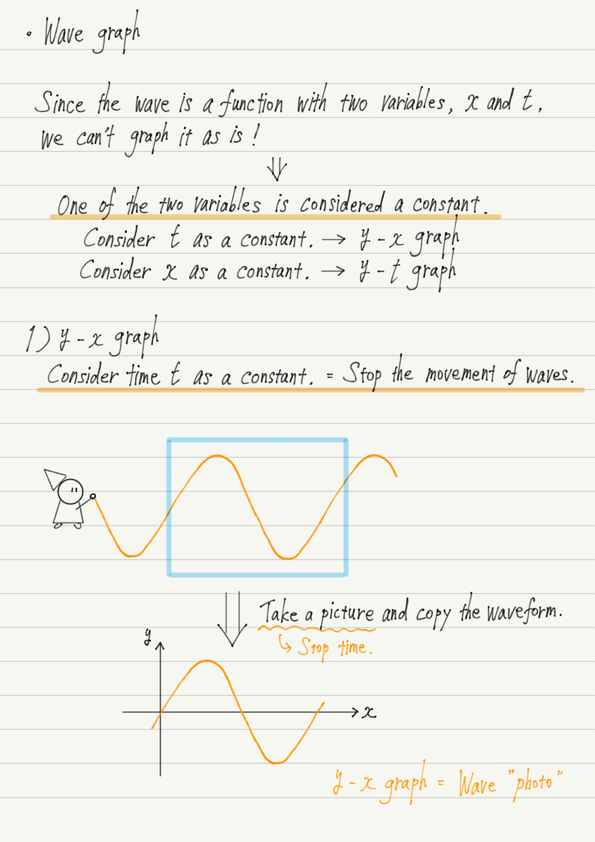
First, of the two variables, we will consider t (time) to be a constant.
To make the time constant is to “stop time”, but don’t think of it as difficult; just think of it as “capturing moving waves in a photograph”.
The waves do not move in the photograph.
In other words, it is as if time has stopped.
If it stopped, we could write it on a graph!
For example, if you are asked to draw a y-x graph at time t = 5s, take a picture of the wave 5 seconds after you start counting time, and that will be the y-x graph you are looking for.
Let’s summarize what we have so far.
We will continue to learn about wave graphs.