Speed of Sound
YUKIMURA
Introduction to High School Physics
First, a review of the previous lecture.
To graph a wave, let’s assume that one of the two variables (t and x) is a constant!
This was the content of the lecture.
And now that we have actually drawn a graph showing the relationship between y and x with time t as a constant, what would happen to the graph if we considered x instead of t to be a constant?
For moving waves, “taking time t as a constant” can be thought of as “taking a picture of the wave”.
So what exactly does it mean to regard x as a constant?
As an example, consider a wave created by swinging a rope, where the value of x represents each point on the rope.
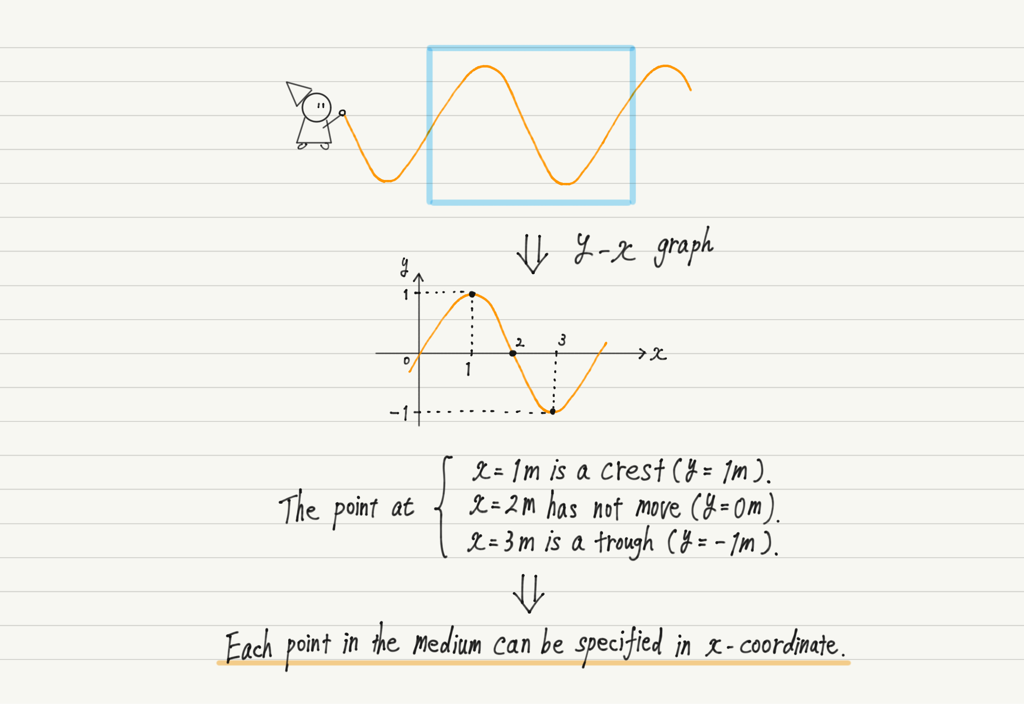
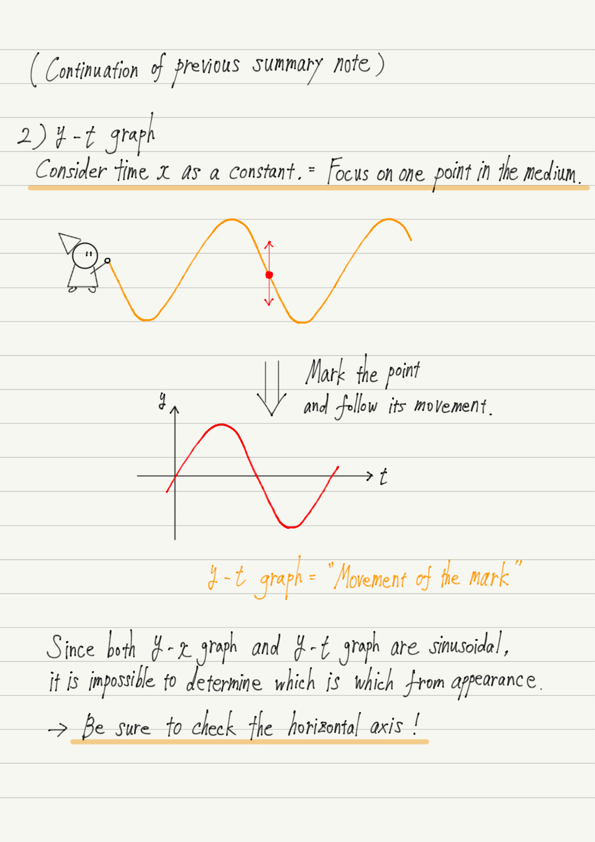
In other words, “regard x as a constant” means “follow only the movement of a single point in the rope”.
If you are asked to draw a y-t graph at x = 5 m, you can mark the x = 5 m point on the rope and follow the movement of that mark.
The y-t graph shows the movement of a mark on a medium with time.
(Note that the y-t graph represents the motion of the medium, not the waveform!)
Now that we have the two types of wave graphs, look closely at the shape of each graph.
Both the y-x and y-t graphs have a sinusoidal shape, and it is impossible to distinguish which graph is which just by looking at the shape!
Whenever you see a graph of waves, be sure to check what the horizontal axis represents!
Now that we have the two graphs, let’s pay attention to their differences and try to read them!