Open End Correction
YUKIMURA
Introduction to High School Physics
Have you ever seen a question with a graph of waves like this?
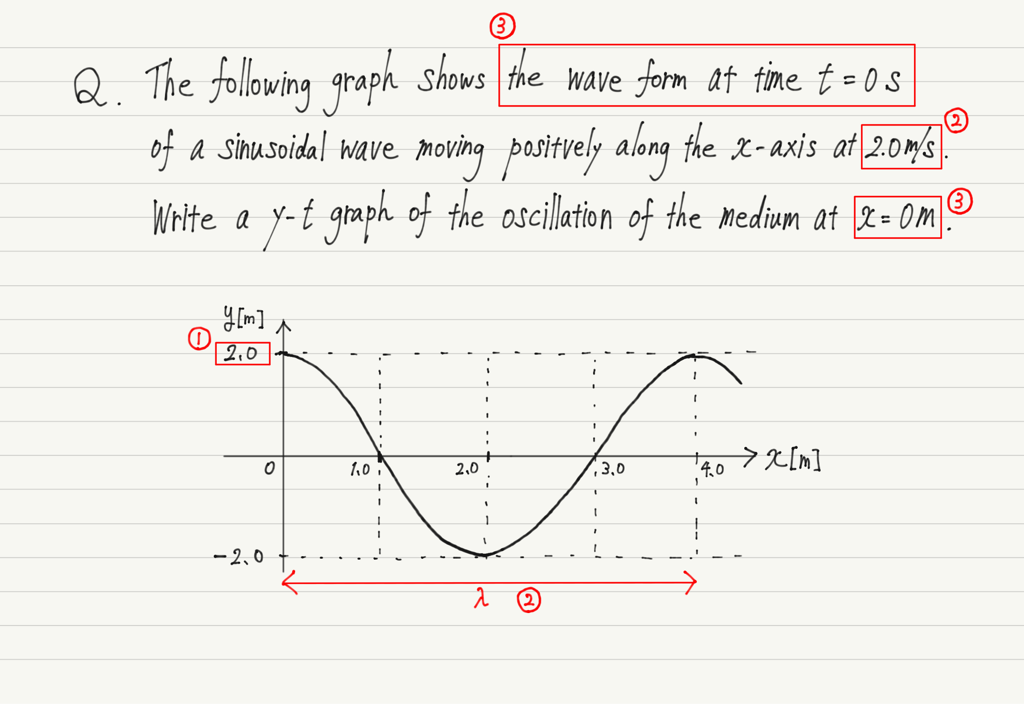
The question is to write a y-t graph based on a given y-x graph.
In this lecture, I’m going to teach you how to approach this type of question!
When you encounter an unfamiliar problem, think simply.
In this case, you are asked to draw a graph, so think about how you can draw a graph.
For example, if you are asked to draw the graph of a linear function, you know that the shape of the graph is a straight line, so all you need to know is the slope and the intercept.
The graph of a quadratic function is a parabola, so it can be drawn if you know the coordinates of the vertex and whether it is convex up or down.
What we are asked to write this time is the y-t graph of a wave.
We already know that the shape of the y-t graph is a sine wave.
Since we know the shape of the graph, all we need to know is the amplitude, the period, and the point through which the graph passes, and we can draw the y-t graph!
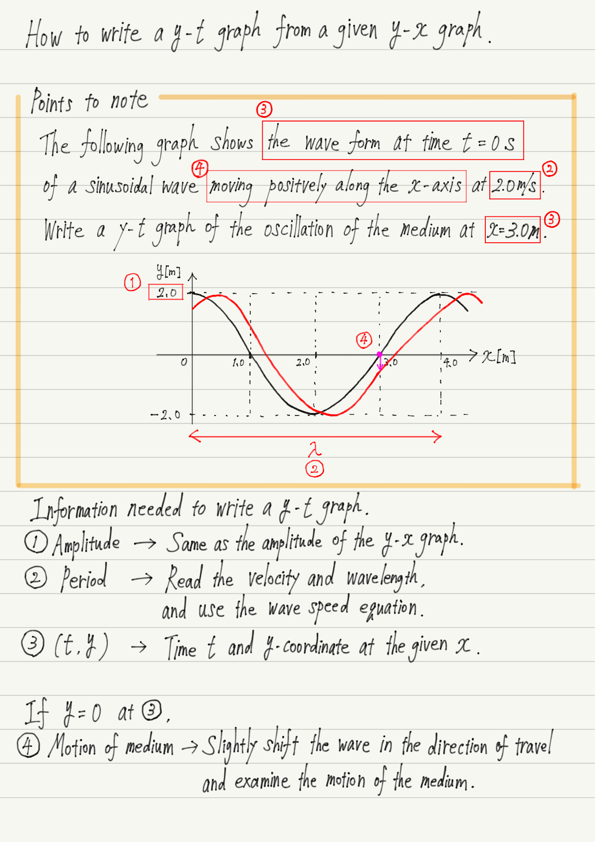
Now let’s find ① the amplitude, ② the period, and ③ the point of pass through, respectively.
The following are the areas of interest for finding ①, ②, and ③.
First, ①. the amplitude.
Since amplitude is the same for both y-t and y-x graphs, we read the amplitude of a given y-x graph and use it as the amplitude of the y-t graph.
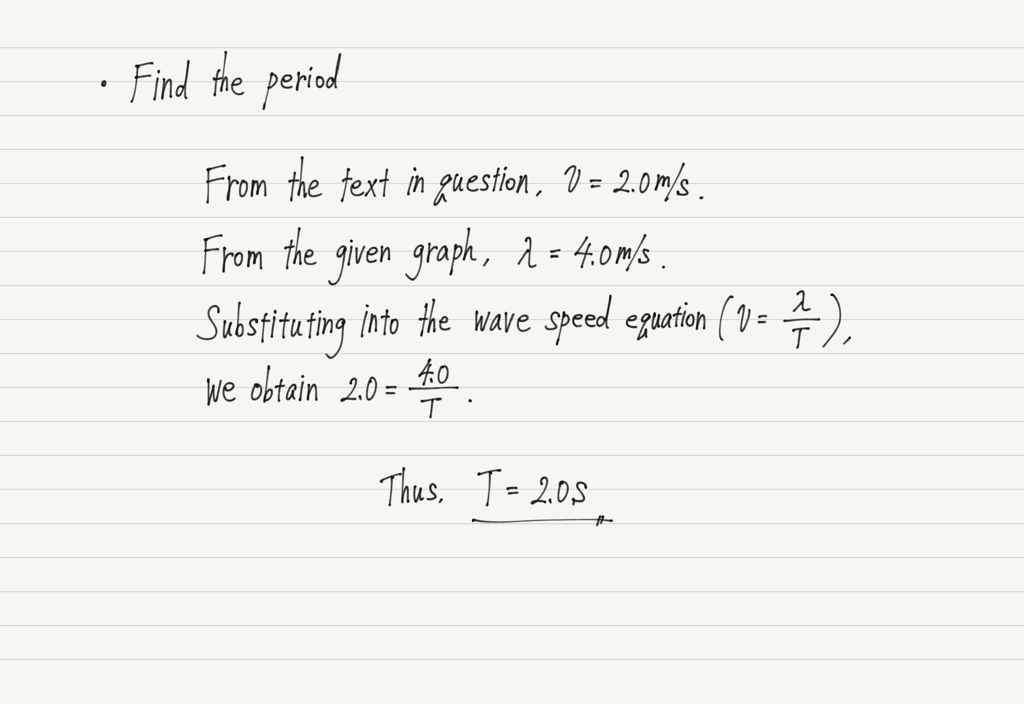
Next, ②. The period, which cannot be read from the y-x graph and used as is, as in ①!
This is because the y-x graph does not contain information about the period.
The only way to get the information not given is by calculation!
Finally, we find a point to pass through. In this type of question, there is always a sentence that says, “The oscillation at x=◯○”, so pay attention to that.
Reads the y-coordinate of a graph at a given x.
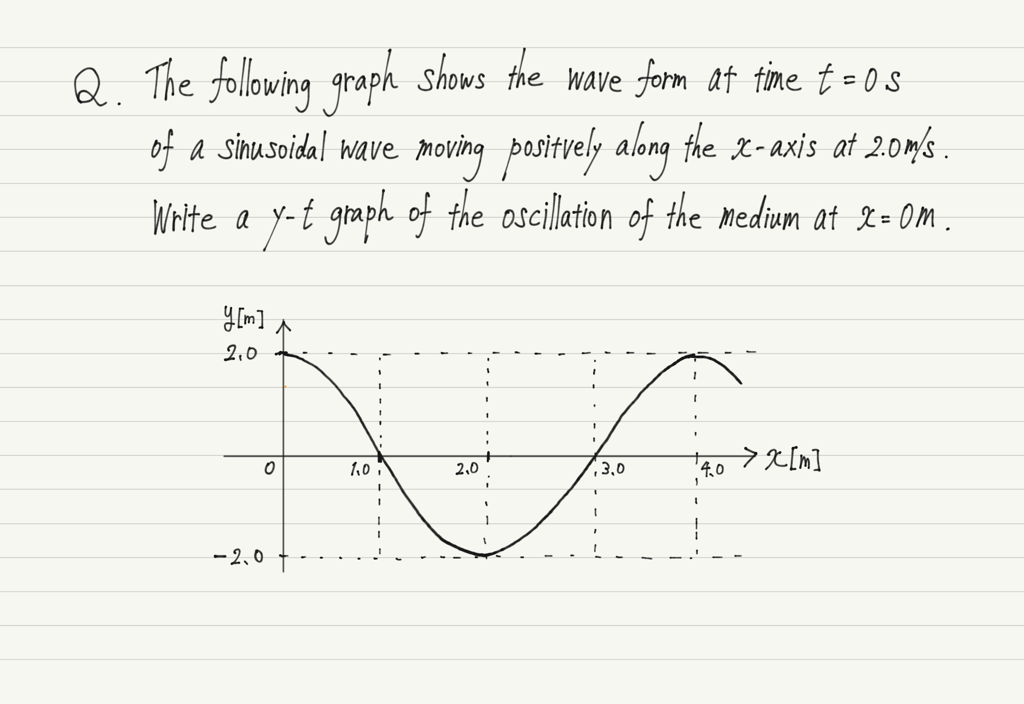
This time the question says “at x=0 m”, so if we read the height of the wave at x=0 m, y=2.0 m.
There is one more part that deserves attention.
It is the part “the wave form at time t=◯◯”.
A y-x graph can be compared to a “picture” of a wave.
The “t=◯◯” in the statement is the time when the camera shutter was pressed.
Without this information, it is impossible to draw a y-t graph.
In this case, the time t=0 s.
Combined with the previous coordinate information, we read “At time t=0 s, the height of the wave at x=0 m is y=2.0 m”.
Since we are writing a y-t graph, let’s eliminate the information about x.
Then “At time t=0 s, the height of the wave is y=2.0 m”.
This is the point through which the y-t graph passes!
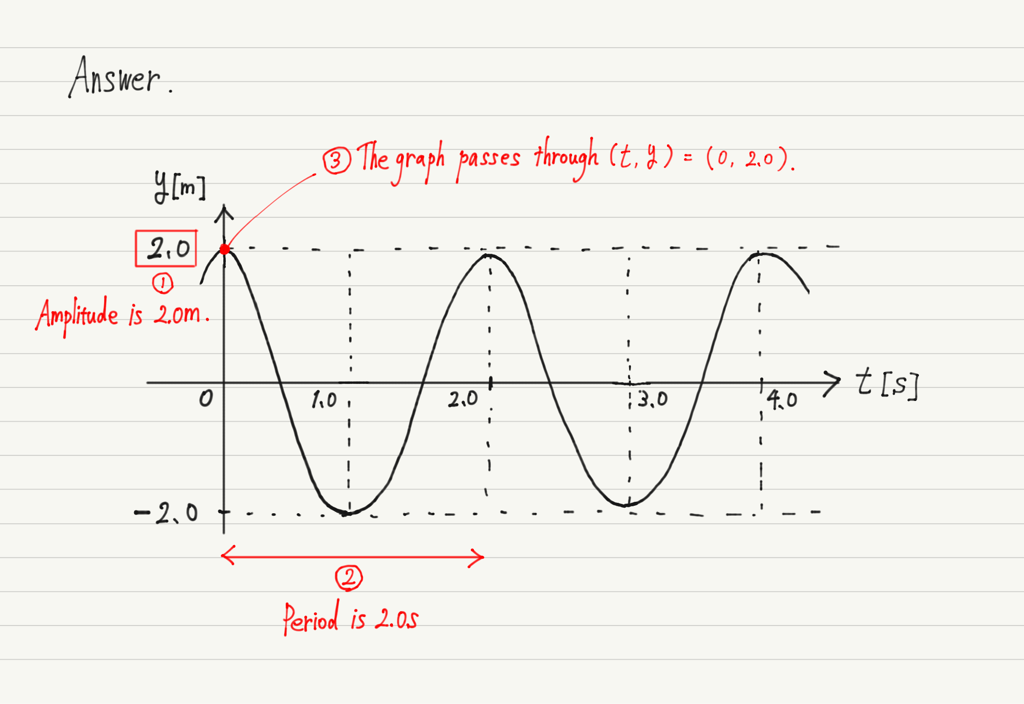
Summarizing the information obtained, a y-t graph can be written as follows.
Let’s try one more question based on what we learned above.
The same settings as in the previous question, but the x=◯◯ part is changed.
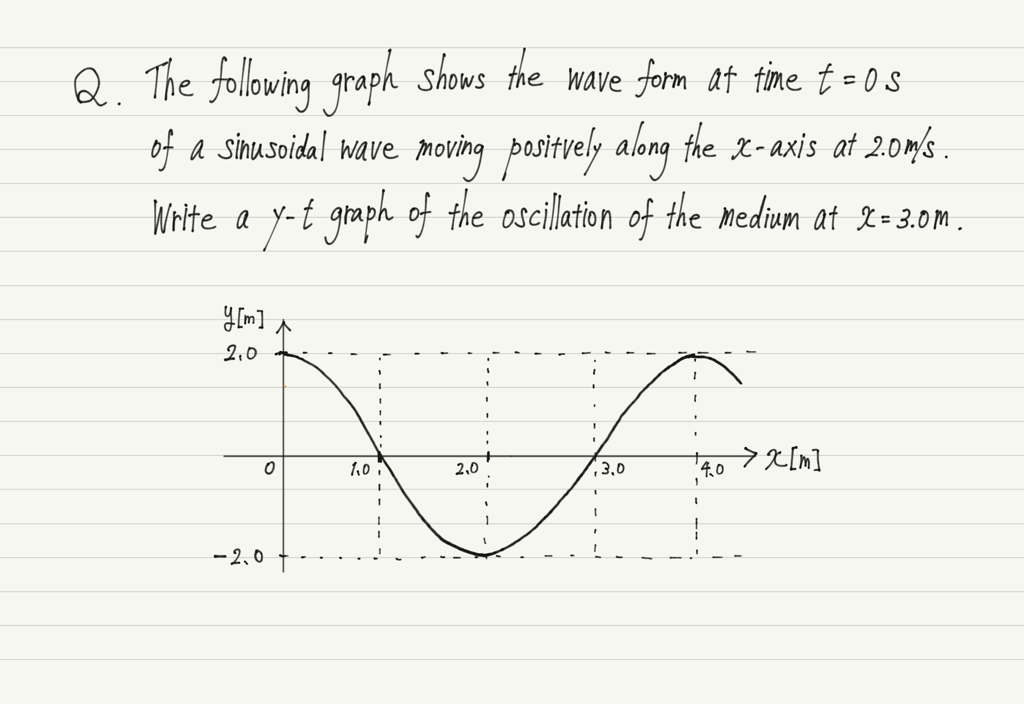
Read the necessary information in the same way as before.
① Amplitude → 2.0 m.
② Period → 2.0 s.
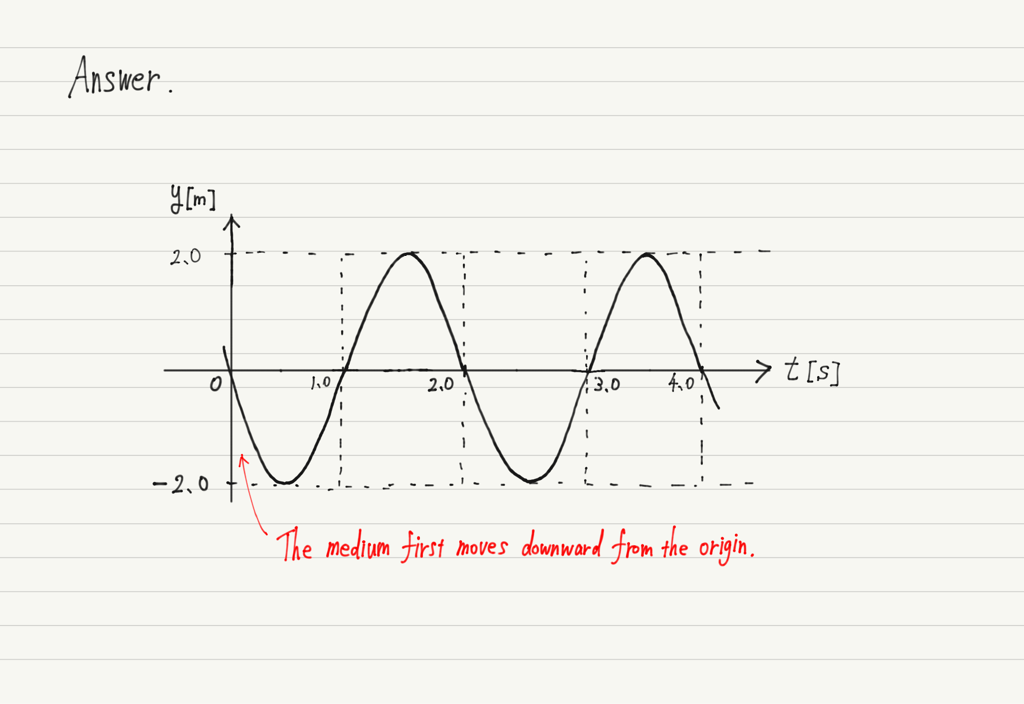
③ Point of pass through → At time t=0 s, the height of the wave is y=0 m.
But this time, this isn’t enough to draw a graph!
This is because there is more than one graph that satisfies the above condition.
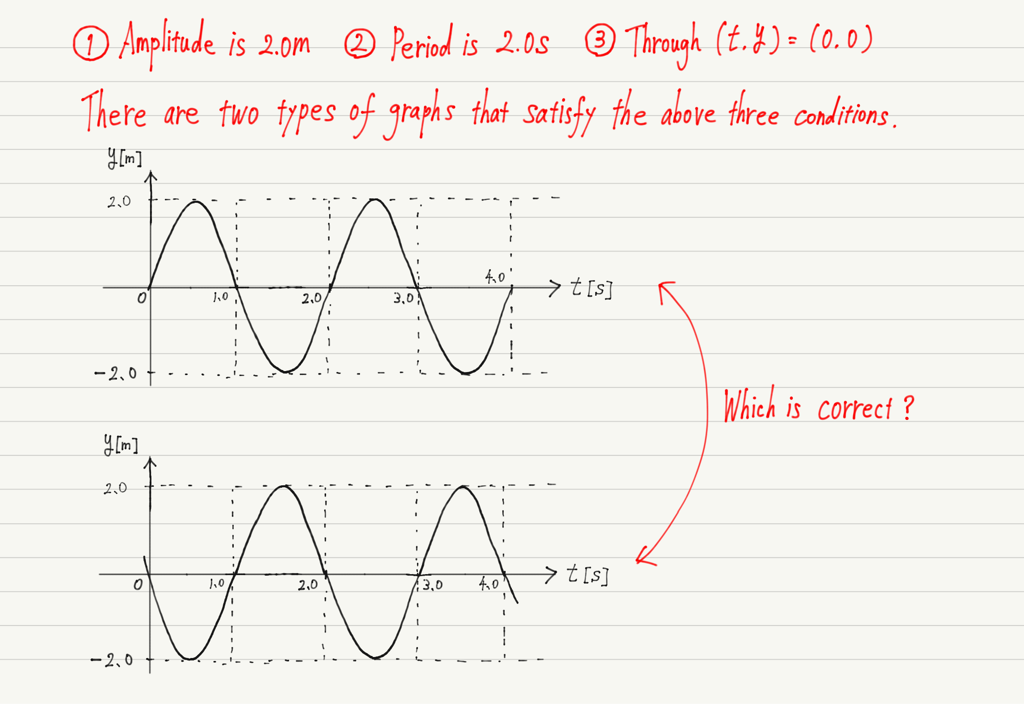
As in the first question, if the passing point is a crest (or trough), the graph can be drawn without any problem.
On the other hand, if the point is in the middle (y=0), as in this case, it is not possible to determine whether the graph will go up or down at the next instant.
This can be solved with one idea.
Remember the previous lecture.
We will use the method we learned here of “shifting the graph slightly in the forward direction”.
Let’s actually do it.
This time, we want to draw a y-t graph at x=3.0 m, so we shift the given graph slightly in the forward direction.
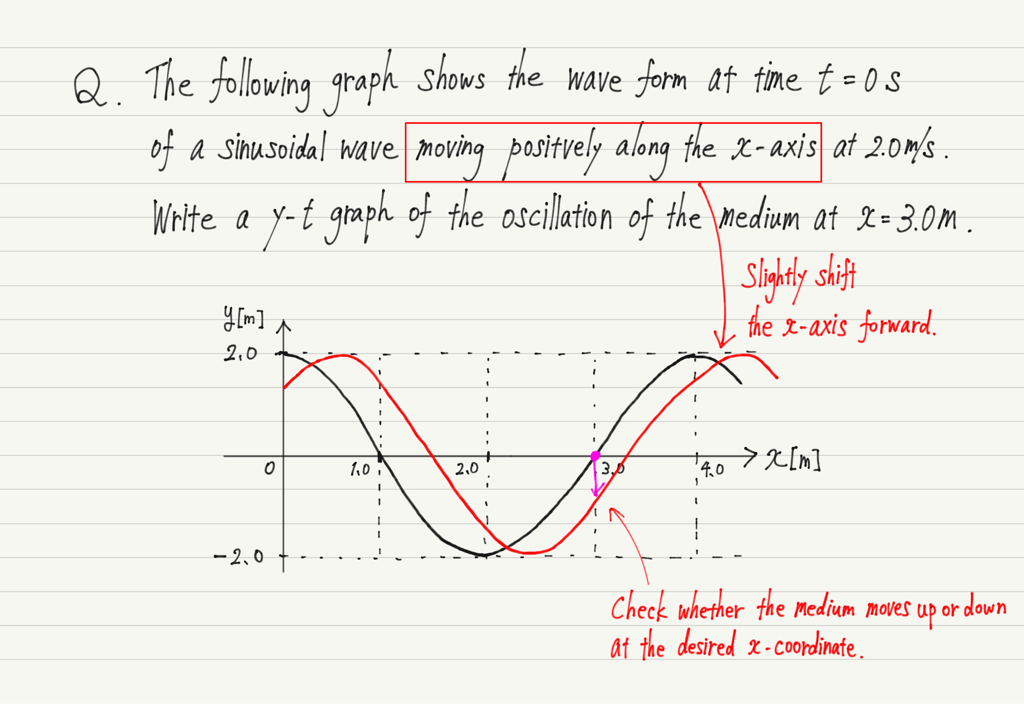
As shown in this figure, the medium at x=3.0 m will move down at the next instant.
Thus, the y-t graph is as follows.