Reflection(Free-End and Fixed-End)
YUKIMURA
Introduction to High School Physics
Previously, we have learned that there are two types of graphs that represent waves.
The theme of this lecture is what information can be read from a wave graph.
The important point in reading a graph of a wave is what the horizontal axis represents.
This is the only thing that matters.
Even though y-x and y-t graphs are completely different graphs, they have the same shape when you just look at the shape, so you cannot determine which graph it is without checking the horizontal axis!
Make it a habit to always check whether the horizontal axis is x or t.
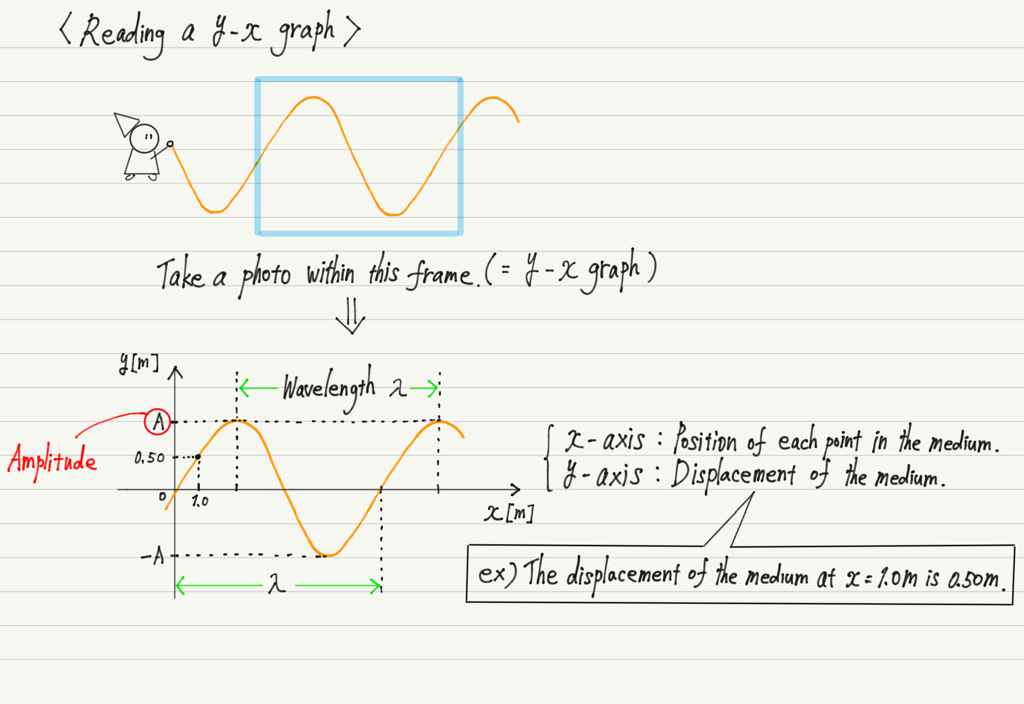
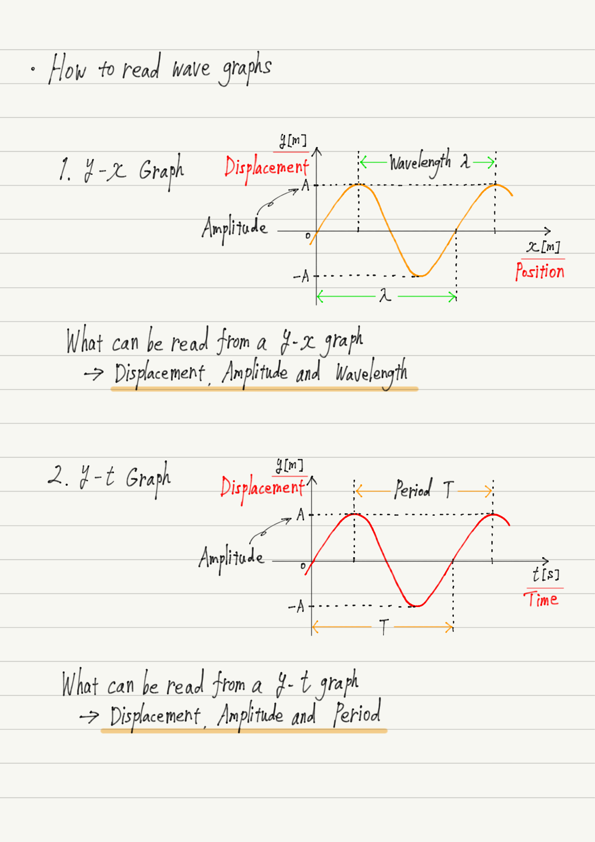
The y-x graph was conceived as a “photo at a certain time of the wave”.
The key to the graph is to read the horizontal and vertical axes.
First, the horizontal axis (x-axis).
If you place a ruler on the photo and measure the length of one wave, you can read the wavelength.
On the other hand, the vertical axis (y-axis) represents the displacement of the medium. This is the same as displacement in mechanics, and is a quantity that expresses “in which direction and over what distance the medium is changing”.
If you have forgotten the displacements you did in mechanics, please review them.
With respect to the x-axis, if the medium is oscillating up, the displacement is positive; if it is oscillating down, the displacement is negative.
The maximum value of displacement (i.e., the height of the crest) is called amplitude.
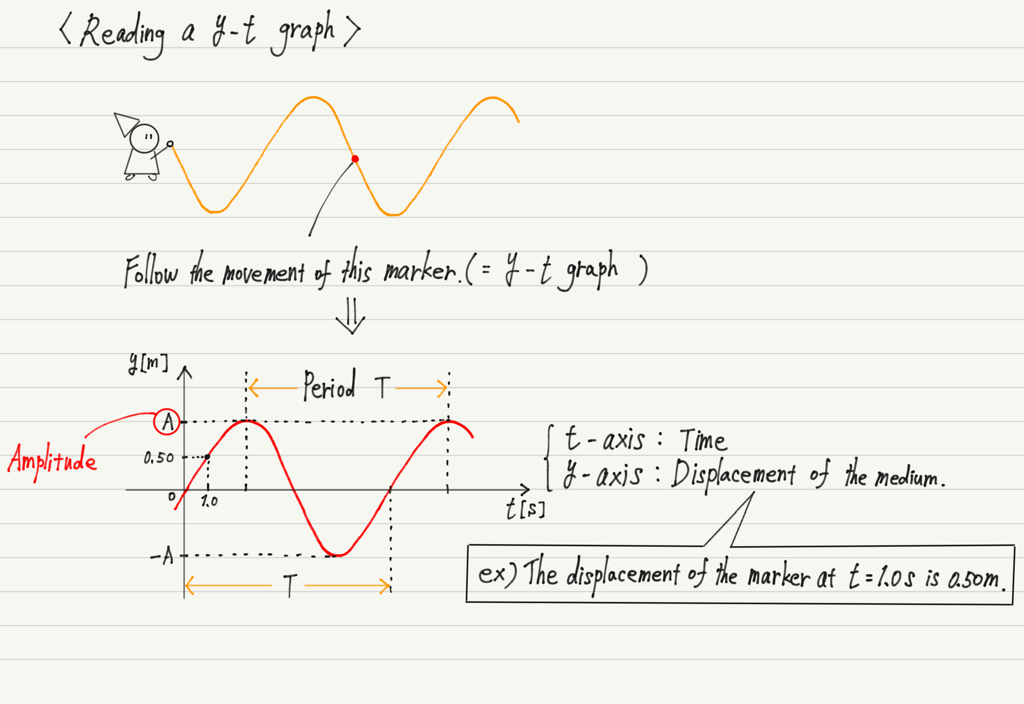
The y-t graph represents “the motion of a point in a medium”.
As time goes by, the mark on the rope is swinging up and down.
What the vertical axis (y-axis) represents is the displacement of the medium.
Only here it is the same as the y-x graph.
Note that the y-x graph shows the displacement “at a point”, whereas the y-t graph shows the displacement “at a time”.
Next is the horizontal axis (t-axis), which represents time.
While the y-x graph reads the length of one wave (= wavelength), the y-t graph reads the time (= period) in which one wave is generated.
These are the two graph readings.
It is important to understand that what can be read from a y-x graph and a y-t graph is different.
Compare the two graphs side by side in the summary note.
Let’s take a break from graphing and get back to learning wave terminology!